Querying USA Spending Data with Python
Introduction
The Department of Treasury recently launched the very cool Beta.USASpending.gov which makes it easy to browse and query for US Government spending data. In this post, we’ll give a quick example of how to use the Python requests module to query this data via the USASpending API, and then create a few plots with pandas.
Pulling the Data
As a simple test case, let’s use the API to pull all the awards from the Department of Defense, following the example given here.
To begin, here is a basic function to pull from the awards endpoint for a given agency (by CGAC code):
import requests

def get_awards(CGAC = None):

    # initialization
    has_next_page = True
    page = 1
    output = []

    while has_next_page:

    	# parameters for request
    	payload = {'awarding_agency__toptier_agency__cgac_code': CGAC, 'page':page}

    	# run the request
    	response = requests.get('https://api.usaspending.gov/api/v1/awards/', params=payload).json()

    	# add response data to output
    	output += response['results']

    	# handle pagination
    	has_next_page = response['page_metadata']['has_next_page']
    	page+=1

    return output
To pull all the DoD data, we now just run the function using the DoD CGAC code:
data = get_awards(CGAC = '097')This returns a list of nested JSON objects corresponding the list of awards. In this case, the API returns 3016 records, each of which looks something like this:
data[0]{u'awarding_agency': {u'id': 1159,
u'office_agency': None,
u'subtier_agency': {u'abbreviation': u'',
u'name': u'Department of the Air Force',
u'subtier_code': u'5700'},
u'toptier_agency': {u'abbreviation': u'DOD',
u'cgac_code': u'097',
u'fpds_code': u'9700',
u'name': u'Department of Defense'}},
u'date_signed': u'2017-02-16',
u'date_signed\_\_fy': 2017,
u'description': u"TAS::57 3600::TAS 'INNOVATIONS IN STATISTICAL IMAGE ANALYSIS AND APPLICATIONS TO 3D IMAGING FOR IMPROVED SSA, DATED 20 JUN 2014'",
u'fain': u'FA95501510286',
u'funding_agency': None,
u'id': 171259,
u'period_of_performance_current_end_date': u'2018-08-14',
u'period_of_performance_start_date': u'2015-08-15',
u'piid': None,
u'place_of_performance': {u'address_line1': None,
u'address_line2': None,
u'address_line3': None,
u'city_name': u'ALBUQUERQUE',
u'country_name': u'UNITED STATES',
u'foreign_city_name': None,
u'foreign_postal_code': None,
u'foreign_province': None,
u'location_country_code': u'USA',
u'state_code': u'NM',
u'state_name': u'NEW MEXICO',
u'zip5': None},
u'potential_total_value_of_award': None,
u'recipient': {u'business_types': None,
u'business_types_description': u'Unknown Types',
u'legal_entity_id': 2049,
u'location': {u'address_line1': u'1700 LOMAS BLVD NE',
u'address_line2': None,
u'address_line3': None,
u'city_name': u'ALBUQUERQUE',
u'country_name': u'UNITED STATES',
u'foreign_city_name': None,
u'foreign_postal_code': None,
u'foreign_province': u'ROMA',
u'location_country_code': u'USA',
u'state_code': u'NM',
u'state_name': None,
u'zip5': None},
u'parent_recipient_unique_id': None,
u'recipient_name': u'UNIVERSITY OF NEW MEXICO'},
u'subaward_count': 1,
u'total_obligation': u'14992.00',
u'total_outlay': None,
u'total_subaward_amount': u'51856.00',
u'type': u'04',
u'type_description': u'Project Grant',
u'uri': None}Exploring the Data
Given the API response data, it’s easy to use pandas to start exploring the data. First, we dump the API response data into a data frame:
import pandas as pd

# creates a data frame with a bunch of nested structure

df = pd.DataFrame(data)
This gives us data frame with a bunch of nested structure like this:
df.head()awarding_agency date_signed \
0 {u'office_agency': None, u'id': 1159, u'subtie... 2017-02-16
1 {u'office_agency': None, u'id': 1141, u'subtie... 2017-01-30
2 {u'office_agency': None, u'id': 1159, u'subtie... 2017-01-01
3 {u'office_agency': None, u'id': 1141, u'subtie... 2017-01-31
4 {u'office_agency': None, u'id': 1141, u'subtie... 2017-01-19
date_signed\_\_fy description \
0 2017 TAS::57 3600::TAS 'INNOVATIONS IN STATISTICAL ...
1 2017 OPTIMIZATION STUDY FOR INTEGRATION OF WIDE-BAN...
2 2017 ADP SUPPLIES
3 2017 THE RECIPIENT SHALL PERFORM A COORDINATED RESE...
4 2017 FLARNG - 1003 - SECURITY GUARDS
fain funding_agency id \
0 FA95501510286 None 171259
1 N000141612940 None 172783
2 None {u'office_agency': None, u'id': 1159, u'subtie... 174371
3 FA86501425800 None 172583
4 W911YN1621003 None 173326
period_of_performance_current_end_date period_of_performance_start_date \
0 2018-08-14 2015-08-15
1 2018-07-31 2017-01-30
2 2017-09-30 2017-01-01
3 2020-05-28 2014-05-08
4 2017-09-30 2016-10-01
piid place_of_performance \
0 None {u'address_line2': None, u'address_line3': Non...
1 None {u'address_line2': None, u'address_line3': Non...
2 FA481417FG034 {u'address_line2': None, u'address_line3': Non...
3 None {u'address_line2': None, u'address_line3': Non...
4 None {u'address_line2': None, u'address_line3': Non...
potential_total_value_of_award \
0 None
1 None
2 6940.00
3 None
4 None
recipient subaward_count \
0 {u'parent*recipient_unique_id': None, u'legal*... 1
1 {u'parent*recipient_unique_id': None, u'legal*... 0
2 {u'parent*recipient_unique_id': None, u'legal*... 0
3 {u'parent*recipient_unique_id': None, u'legal*... 0
4 {u'parent*recipient_unique_id': None, u'legal*... 0
total_obligation total_outlay total_subaward_amount type \
0 14992.00 None 51856.00 04
1 113079.00 None None 04
2 6940.00 None None C
3 302000.00 None None 05
4 297906.00 None None 05
type_description uri
0 Project Grant None
1 Project Grant None
2 Delivery Order None
3 Cooperative Agreement None
4 Cooperative Agreement None One interesting thing we can look at straight away is the distribution of award sizes, using the total_obligation field, which the data dictionary defines as “The amount of money the government is obligated to pay for the award”.
First a few summary statistics:
df.total_obligation.describe()count 3016.000000
mean 290584.619460
std 922759.315605
min -2200666.000000
25% 14377.110000
50% 87368.500000
75% 240431.500000
max 20091931.000000
Name: total_obligation, dtype: float64It looks like the average award is about ~$290k, with the largest being just over $20M. The $20M award is this one, titled “1001 PA ARMY NATIONAL GUARD FACILITIES PROGRAM” that went to PA Military & Veterans Affairs, which makes sense.
One odd thing we notice is that some awards seem to be negative. In fact, this includes about 3% of the awards in the sample. I’m not sure exactly why this would be the case, but one hypothesis is that these are de-obligations e.g. when money is returned to the DoD because a project came in under budget. Some of these negative awards are quite large–e.g. this one that appears to be related to funding for this study on treating severe traumatic injury and haemorrhagic shock.
In any case, let’s remove the negative awards, and take a look at the full distribution of award sizes from the DoD (using the seaborn package; code excluded):
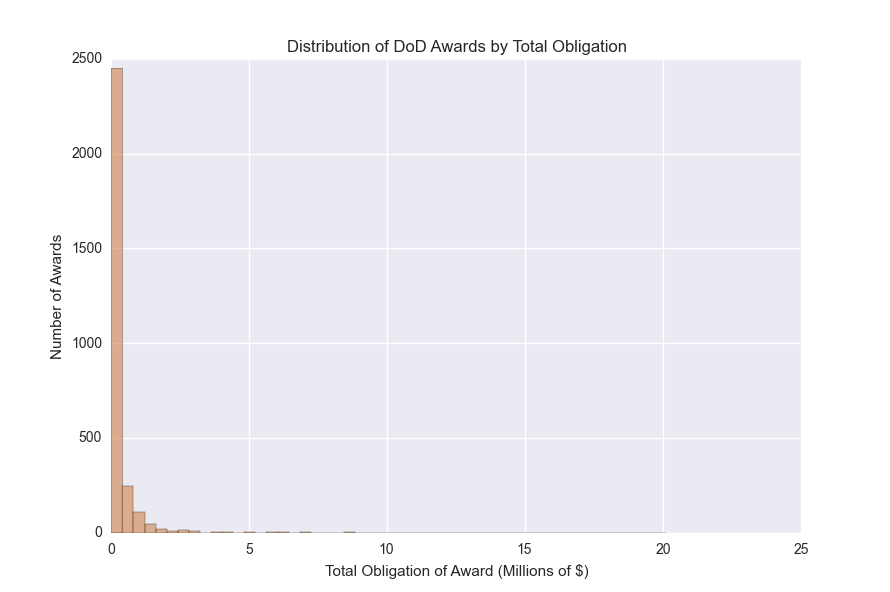
We see that most of the awards are on the low end of the distribution (< $1M), though there is a long tail of much larger awards.
Conclusion
There is much more that we can do with this data. The goal of this post has been to give a basic overview of how to access the USASpending data and manipulate it using python and pandas.