Advisee Network Visualization
For Max Bazerman, I built this interactive visualization of his advisee network (i.e. everyone he has advised and who they have advised). This was a fun little project that involved using python (NetworkX) to process the network data, and javascript (Viz.js) to construct the visualization. All the code and raw data are available in github here.
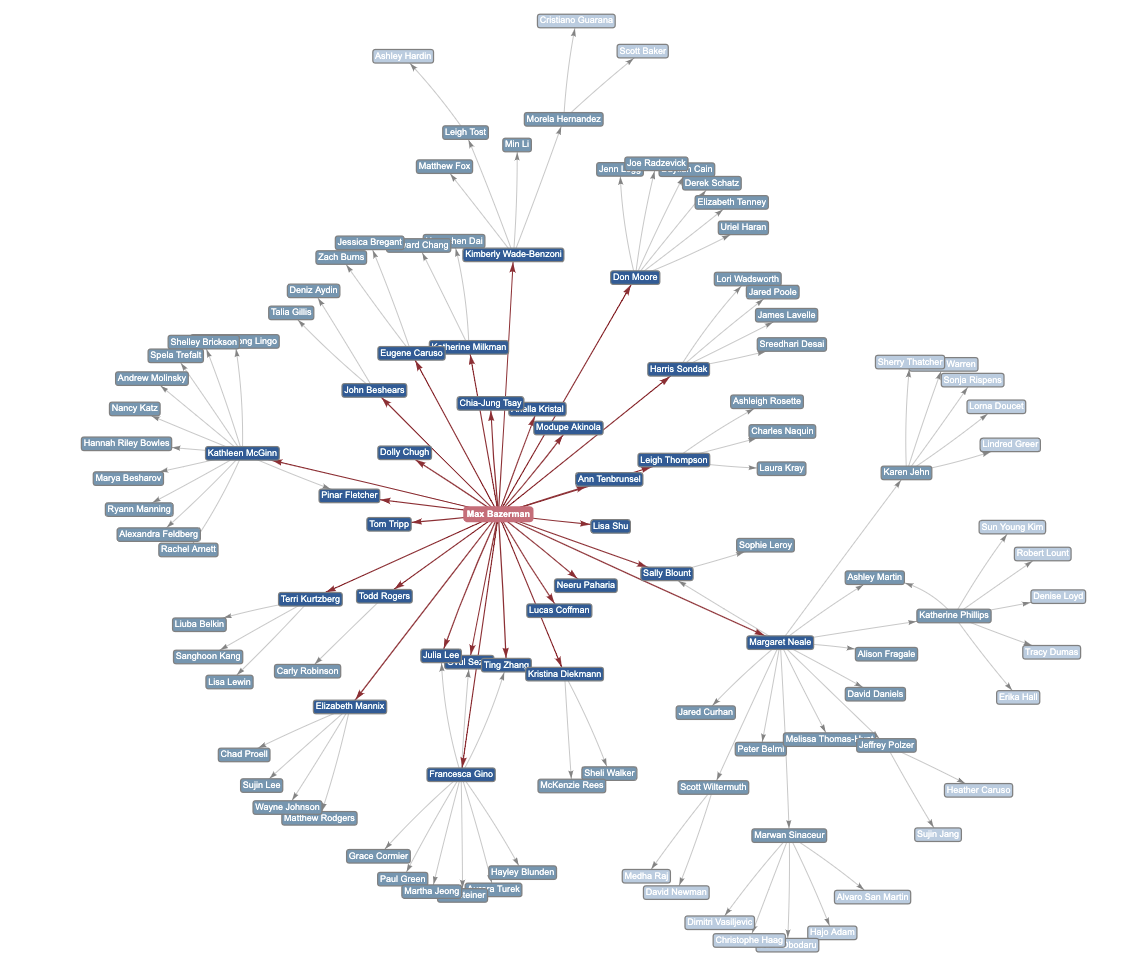
Check out the interactive version here! You can click the nodes to drag or highlight. Double clicking takes you to the corresponding person’s website if available.