Algorithmic Feed Theoretical Modeling
Intro
Today, I am going to attempt to write down a complete theoretical model for this set of ideas about the effects of algorithmic curation that I posted a while back. I am not too experienced on writing down / solving theoretical models, so this will be a good chance to try.
Intuitions and Planning
Let’s start by trying to clarify the key entities and elements that I want to capture in the model. There are three key decision-making entities I am interested in modeling:
- Content creators (e.g. on YouTube/TikTok)
- Content viewers (i.e. people scrolling/watching the content)
- The content platform (e.g. YouTube).
Further, to capture the intuitions I am interested in, there are also a few other concepts I will need to represent theoretically:
- A piece of content – e.g. a single Tik Tok video.
- The prediction technology – i.e. how well can the platform predict whether a given viewer will watch a given piece of content.
- Ultimately, the main comparative static I want to be able to look at is how equilibrium outcomes change as the quality of the prediction technology improves – so I will need a clean way to represent this.
- The feed – i.e. the piece(s) of content that the platorm will serve to the viewer.
- The following relationship (i.e. does a given viewer follow/subscribe to a given creator).
With these elements on the table, let’s next think about which decisions I want to model for each of the decision-makers:
- For creators:
- Whether to create content.
- What “type” of content to create.
- For viewers:
- Whether to “follow” a given creator.
- Whether/how much to consume the content offered in the feed.
- For platforms:
- Which pieces of content to show a given viewer in their feed (given the quality of the prediction technology).
Simplest Possible Setup
With these ideas on the table, let’s now try to write down and solve the simplest possible version of a game-theoretic model.
For simplification, let’s start by exogenizing the creator part of the analysis, and imagine that there are just two horizontally-differentiated creators positioned at the ends of an interval from 0 to 1. Let’s call them “creator 0” and “creator 1” based on their locations. Their locations on the line represent horizontal differentiation in content (e.g. cat videos vs. political discussions).
To start, suppose that each creator $j$ will exogenously create a single piece of content that I will label $c_j$ (where $j \in \{0,1\}$).
Next, suppose that there is likewise a continuum of consumers indexed by $i \in [0,1]$ positioned along the interval. Let $u_i(.)$ be the utility function for consumer $i$. Assume that:
\[u_i(c_j) := u_{ij} = \epsilon_j - \beta (j-i)^2\]where $\beta > 0$ is the same for all consumers, and $\epsilon_j \in [0,1]$ represents the “vertical” quality of the piece of content $j$. For now, let’s assume that $\epsilon_j$ is exogenous and out of the creator’s control. To start, let’s assume $\epsilon_j \sim U(0,1)$ is standard uniform.
What does this utility function mean? Well, the term $-\beta(j-i)^2$ is decreasing in the absolute difference between $j$ and $i$; in other words, consumer $i$ is generally happiest consuming content from the creator closest to them on the line; however, vertical differences in quality can offset this. The coefficient $\beta$ captures the relative importance of vertical vs. horizontal preferences. For simplicity we might start with $\beta=1$ since $(j-i)^2 \in [0,1] \forall i,j$.
Suppose that all consumers have an outside option with utility normalized to 0. So consumer $i$ will consume the piece of content $c_j$ if $u_i(c_j) > 0$.
Next, let’s consider the platform and its decision. In this simple setup, let’s assume that the platform is going to be in charge of creating the “feed” for each consumer $i$. For now, each feed will consist of one piece of content (i.e. either $c_0$ or $c_1$). Let $f(i)$ be the platform’s content choice for the feed of viewer $i$. Assume that $f:[0,1] \rightarrow \{0, 1\}$; i.e. $f$ maps a viewer to the index of a piece of content. Intuitively, I want for the platform’s profit to be a function of the number of “views”/engagement. Concretely, we can suppose that the platform’s payoff function is:
\[P = \int_0^1 v_i(c_{f(i)}) d_i\]where $v_i$ is an indicator of whether viewer $i$ views the piece of content $c_{f(i)}$ that the platform puts in their feed.
What will be the structure of the game? To start, let’s assume there are three stages (two “real” stages):
- [Nature] The two creators $j=0$ and $j=1$ produce pieces of content $c_j$ (i.e. nature draws the $\epsilon_j \sim U(0,1)$).
- [Platform] The platform chooses a strategy $f$ for allocating content to viewers’ feeds.
- [Viewers] Viewers decide whether to view the piece of content in their feed.
This is straightforward enough so far, but what we are still missing is the prediction technology. In short, we need to decide what the platform knows about the content and the viewers when it makes its choices about the feed. What I am not sure about here is whether prediction should be about vertical quality or horizontal match quality or both. Let’s set up for both and try different cases.
In particular, first suppose that when deciding on the feed for consumer $i$, the platform has uncertainty about the consumer’s horizontal prefernces (i.e. the value of $i$) and instead observes some noisy signal $i’= i + \eta_i$ where $\eta_i \sim_{iid} N(0,\sigma_{\eta})$. Similarly, suppose that the platform observes some noisy signal of the veritical quality of the content $c_j$ – i.e. they observe $\epsilon_j’ = \epsilon_j + \delta_j$ with $\delta_j \sim_{iid} N(0,\sigma_{\delta})$ . We can then model increasing prediction quality by decreasing either of the $\sigma$. Note we can also model no uncertainty (perfect prediction) by setting either $\sigma=0$.
Solving the Simple Model
We now have all the pieces and can try solving by backwards induction for a representative viewer $i$.
In the third stage of the game, viewer $i$ receives some piece of content $f(i)$. They will view it if $u_i(f(i)) > 0$. From above, we have $u_i(f(i)) > 0$ if: $\epsilon_{f(i)} > \beta (f(i)-i)^2$. Note that I am assuming that the viewer has all the information needed to make this decision (i.e. they perfectly observe $\epsilon$ and $i$). This may seem a little weird, but really I am thinking about it as: the viewer will consume this content and decide to continue watching if they get positive utility.
Now, in the second stage of the game the platform has to decide on $f(i)$. Given their payoff, they want to choose $f(i)$ for a given consumer to maximize the probabability of a view, given their uncertainty about $i$ (the horizontal preferences of the viewer) and $\epsilon_j$ (the vertical quality of the content). That is, for individual $i$ they want to solve:
\[\text{argmax}_{j} Pr(\epsilon_{j} > \beta (j-i)^2 | \epsilon_j', i').\]To simplify for now, let’s assume $i$ is known, so the platform only has uncertainty about the vertical quality. So they want to solve:
\[\text{argmax}_{j} Pr(\epsilon_{j}'-\delta_j > \beta (j-i)^2)\]since $\epsilon_{j}’-\delta_j = \epsilon_j$. We can rewrite this probability as
\[Pr(\delta_j < \epsilon_{j}'-\beta (j-i)^2) = \Phi\left(\frac{\epsilon_{j}'-\beta (j-i)^2}{\sigma_\delta}\right)\]where $\Phi$ is the standard normal CDF. The platform has all the information to make this decision now since they observe $\epsilon_{0}’$ and $\epsilon_{1}’$. They should recommend $c_1$ iff
\[\Phi\left(\frac{\epsilon_{1}'-\beta (1-i)^2}{\sigma_\delta}\right) > \Phi\left(\frac{\epsilon_{0}'-\beta (-i)^2}{\sigma_\delta}\right)\] \[\leftrightarrow \epsilon_{1}'-\beta (1-i)^2 > \epsilon_{0}'-\beta (-i)^2\]So essentially, the platform should recommend whichever piece of content has higher expected utility for consumer $i$ given the signals it observes. The prediction quality does not matter at all here for the platform’s decision. We can solve for $i$ to get the exact policy. Solving the above inequality for $i$ implies that the platform should recommend $c_1$ iff:
\[i > \frac{\beta + \epsilon_0' - \epsilon_1'}{2\beta}.\]The RHS here is decreasing in $\epsilon_1’ - \epsilon_0’$ as we’d expect – i.e. the larger the gap in signals in favor of $1$, the lower the threshold should be (i.e. more users should get recommended $c_1$). Likewise, as $\beta$ increases, the threshold also increases, since the strength of horizontal preferences are increasing.
This all seems pretty standard so far, though it’s nice to have something written down to build on. I guess a more interesting question now is to think about welfare. In particular, I would like to understand how platform, viewer, and creator welfare change as a function of $\sigma_\delta$. Intuitively, I would expect that expected platform and viewer welfare should increase as prediction gets better.
Let’s first try to write down the viewer’s expected utility on this setup. This starts to get trickier to write down in closed form. Recall we have that the user’s utility is given:
\[u_i(c_j) = \epsilon_j - \beta (j-i)^2\]By above, they will get $c_1$ if the following is true, and $c_0$ otherwise:
\[i > \frac{\beta + \epsilon_0' - \epsilon_1'}{2\beta} \iff i > \frac{\beta + (\epsilon_0+\delta_0) - (\epsilon_1+\delta_1)}{2\beta}\]Let $A$ be the event that this inequality is satisfied. Then we have:
\[E[u_i] = E[\max(u_i(c_1),0) | A]P(A) + E[\max(u_i(c_0),0) | \sim A](1-P(A))\]It might be possible to simplify this with some more thought (and/or tweaks to the setup). But for now, let’s try just running a simulation to see what’s going on.
I will start by looking at the platform’s recommendation decision as a function of $\sigma_d$ (i.e. prediction quality). Here is some simple code taking $\beta=1$ for now:
n_sims <- 10000

get_i_thresh <- function(n_sims, sigma_d, beta) {

  e_0 <- runif(n_sims)
  e_1 <- runif(n_sims)

  d_0 <- rnorm(n = n_sims, mean = 0, sd = sigma_d)
  d_1 <- rnorm(n = n_sims, mean = 0, sd = sigma_d)

  i_thresh <- pmin(pmax((beta + e_0 + d_0 - (e_1 + d_1))/(2*beta), 0), 1)

  return(i_thresh)
}

beta_vals <- c(1)
sigma_d_vals <- seq(0, 1.5, 0.5)

results <- expand.grid(sigma_d = sigma_d_vals, beta = beta_vals, stringsAsFactors = FALSE)
results$i_thresh <- mapply(get_i_thresh, n_sims, results$sigma_d, results$beta, SIMPLIFY = FALSE)
Here is a plot of the results:
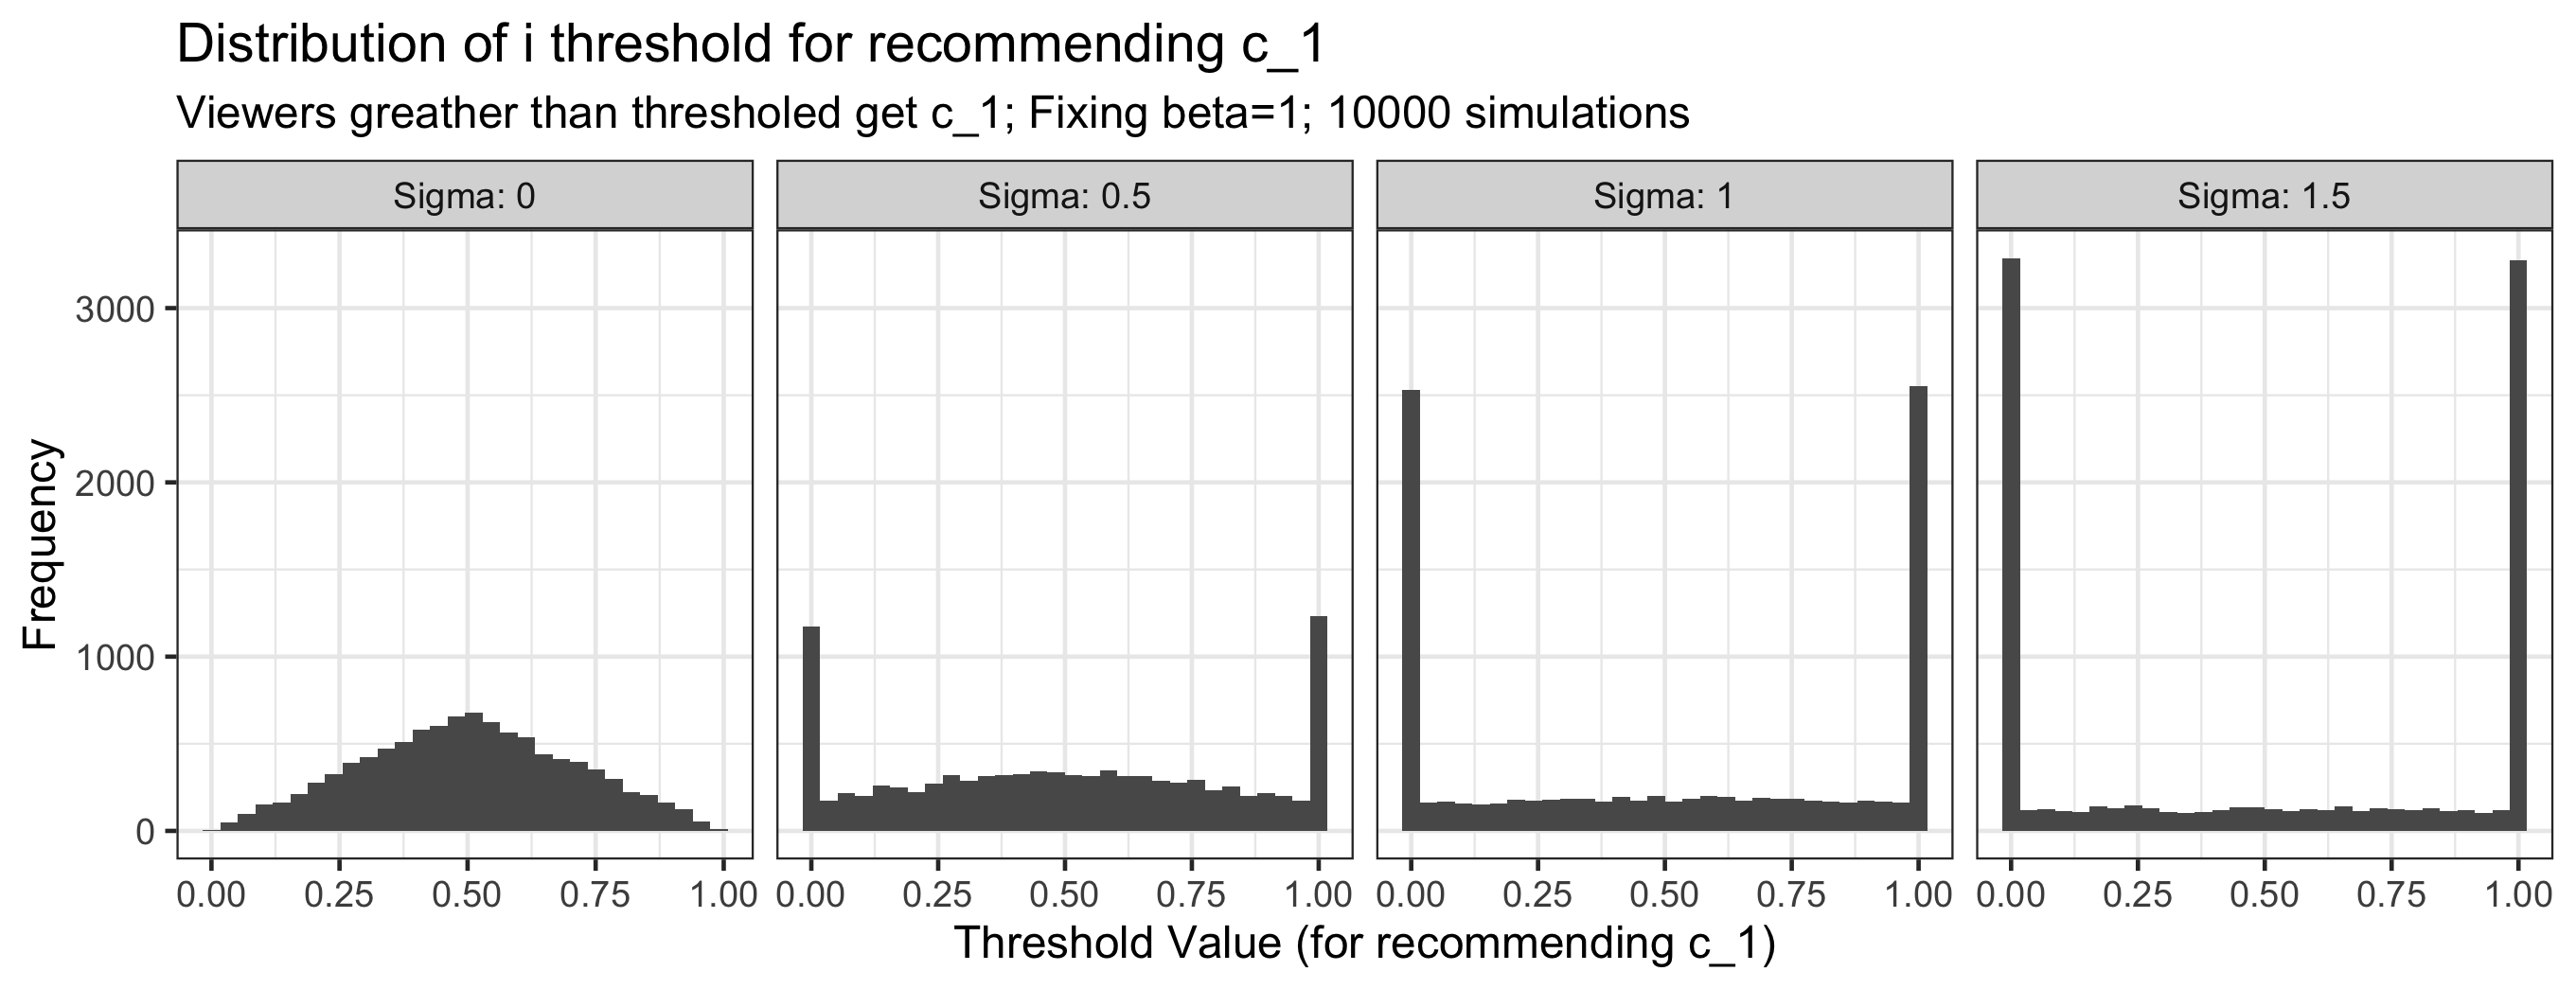
Two comments:
- The distribution is always symmetric and so the expected threshold is always $i=.5$; this makes sense given that the setup is symmetric.
- As $\sigma_\delta$ increases (i.e. prediction quality decreases), the distribution becomes more polarized. Intuitively, I guess that this is because increasing $\sigma_\delta$ means that $\epsilon_0’ - \epsilon_1’$ is more likely to be very positive or very negative, meaning the threshold will either be 1 or 0. This was not really my intuition at the start of this exercise, so I will have to think more about this and whether it is interesting or a limitation of my setup.
In any case, this does not yet tell us anything about welfare, since we are not yet checking which viewers actually watch the content. Recall that user $i$ will watch a piece of content $c_j$ iff:
\[u_i(c_j) = \epsilon_j - \beta (j-i)^2 > 0\]This simplifies to say that user $i$ will watch $c_j$ iff $\epsilon_j/\beta > (j-i)^2$ which makes sense. In other words:
- User $i$ will watch $c_1$ iff $i > 1 - \sqrt{\epsilon_1/\beta}$
- User $i$ will watch $c_0$ iff $i < \sqrt{\epsilon_0/\beta}$
So now we have two more thresholds which we can use (in tandem with the platform’s threshold) to determine the proportion of users that will watch the content. In particular, define:
- $i_{1, plat} = \frac{\beta + \epsilon_0’ - \epsilon_1’}{2\beta}$
- $i_{1, watch} = 1 - \sqrt{\epsilon_1/\beta}$
- $i_{0, watch} = i < \sqrt{\epsilon_0/\beta}$
Using these thresholds, we can compute the proportion of viewers who watch each piece of content in our simulation:
run_simulation <- function(n_sims, sigma_d, beta) {
e_0 <- runif(n_sims)
e_1 <- runif(n_sims)
d_0 <- rnorm(n = n_sims, mean = 0, sd = sigma_d)
d_1 <- rnorm(n = n_sims, mean = 0, sd = sigma_d)
i_thresh <- pmin(pmax((beta + e_0 + d_0 - (e_1 + d_1))/(2*beta), 0), 1)
i_1_watch<-1-sqrt(e_1/beta) # above this, watch 1
i_0_watch<-sqrt(e_0/beta) # below this, watch 0
share_watch_1 <- 1-pmax(i_1_watch, i_thresh)
share_watch_0 <- pmin(i_0_watch, i_thresh)
share_watch_none <- 1-share_watch_1-share_watch_0
return(data.frame(i_thresh, i_1_watch, i_0_watch, share_watch_1, share_watch_0, share_watch_none, sigma_d, beta))
}
results <- rbind(run_simulation(10000, sigma_d = 0, beta=1),
run_simulation(10000, sigma_d = .5, beta=1),
run_simulation(10000, sigma_d = 1, beta=1),
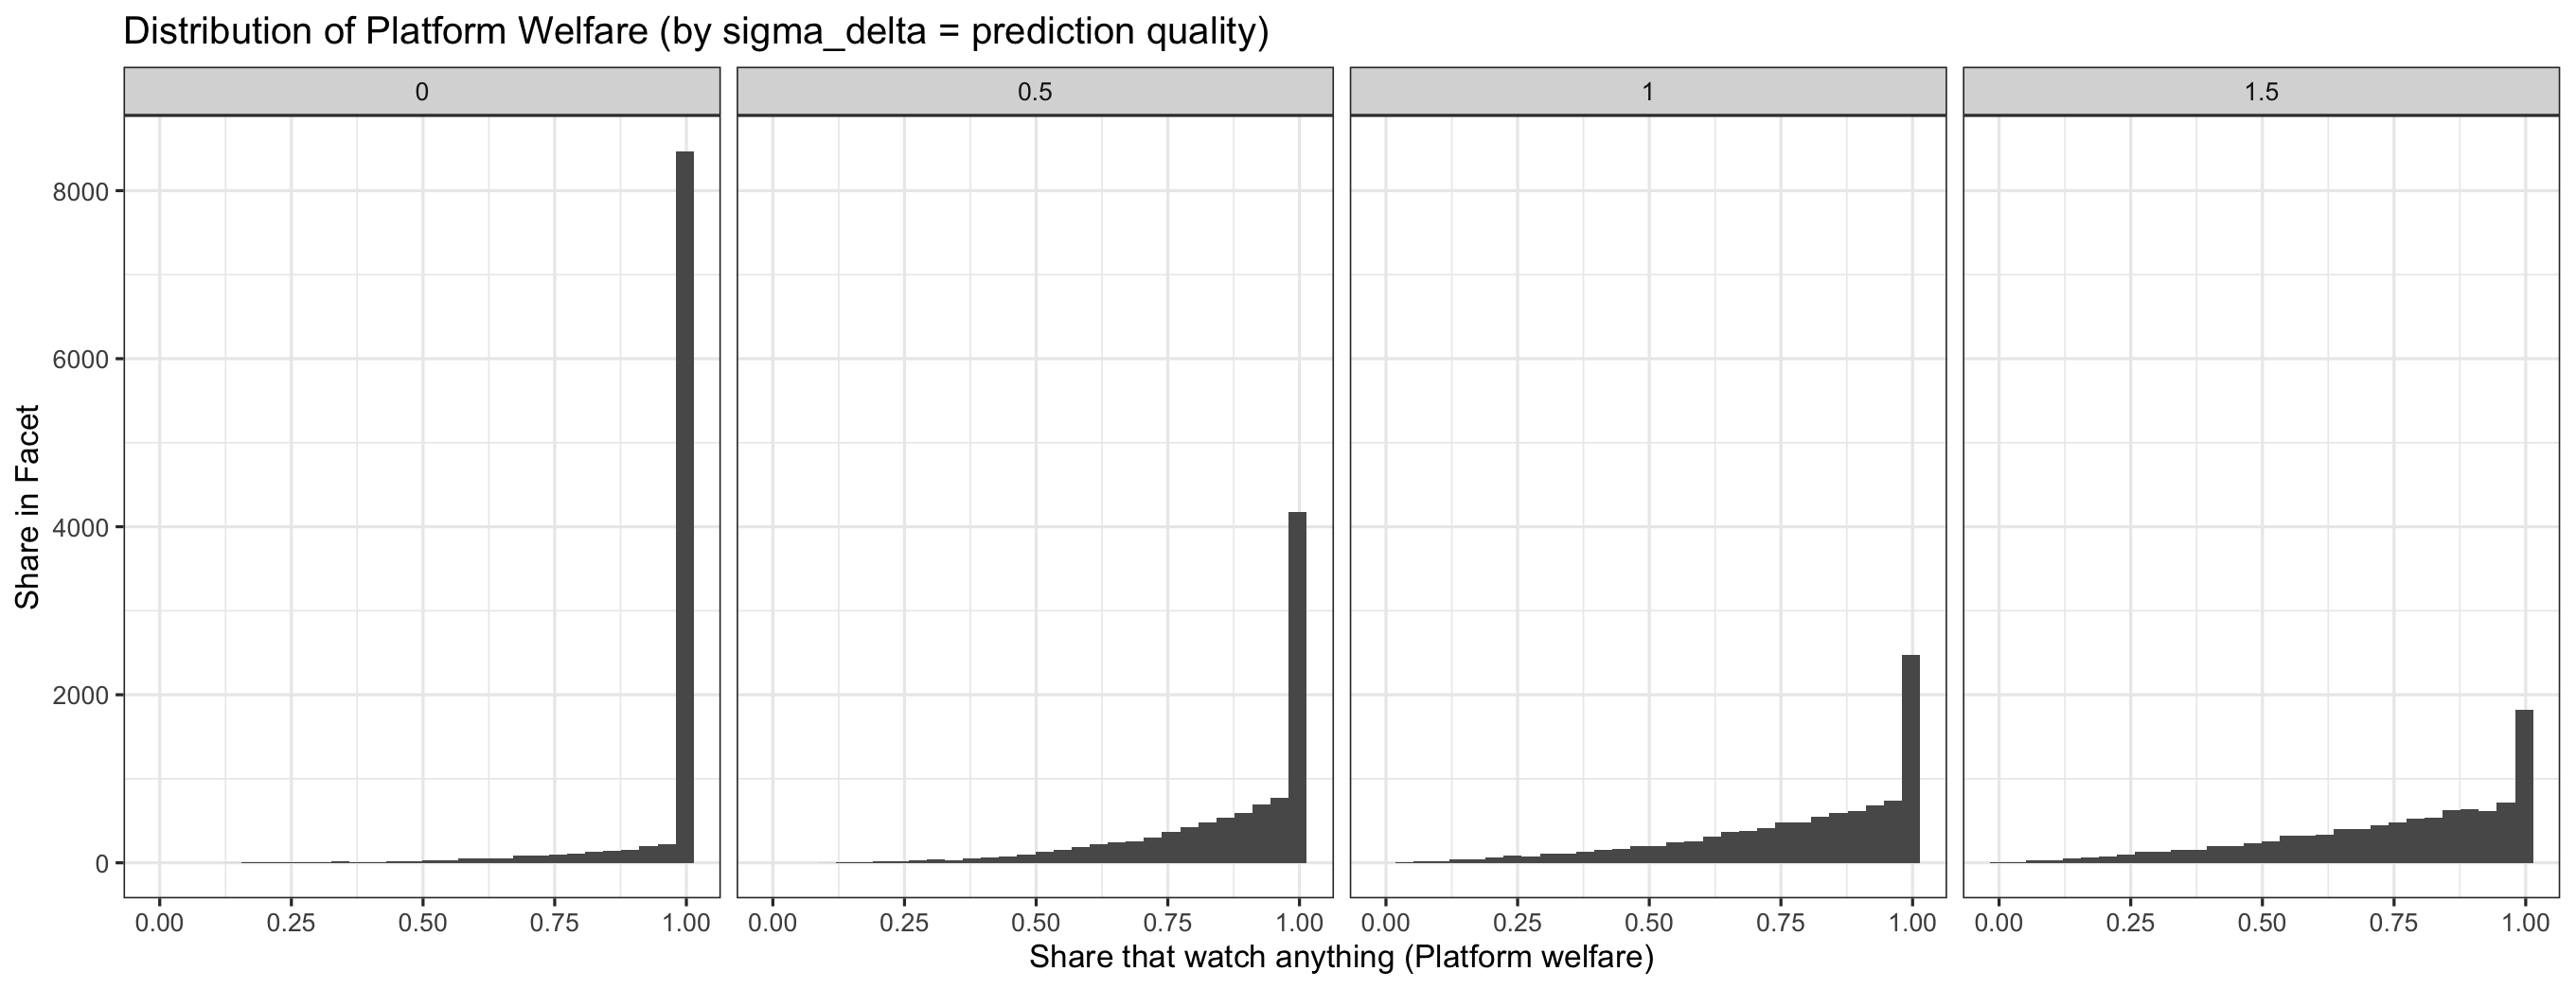
run_simulation(10000, sigma_d = 1.5, beta=1))Here is a plot of the distribution of platform welfare (i.e. the count of users that watch any video) across my simulations for different values of prediction quality:
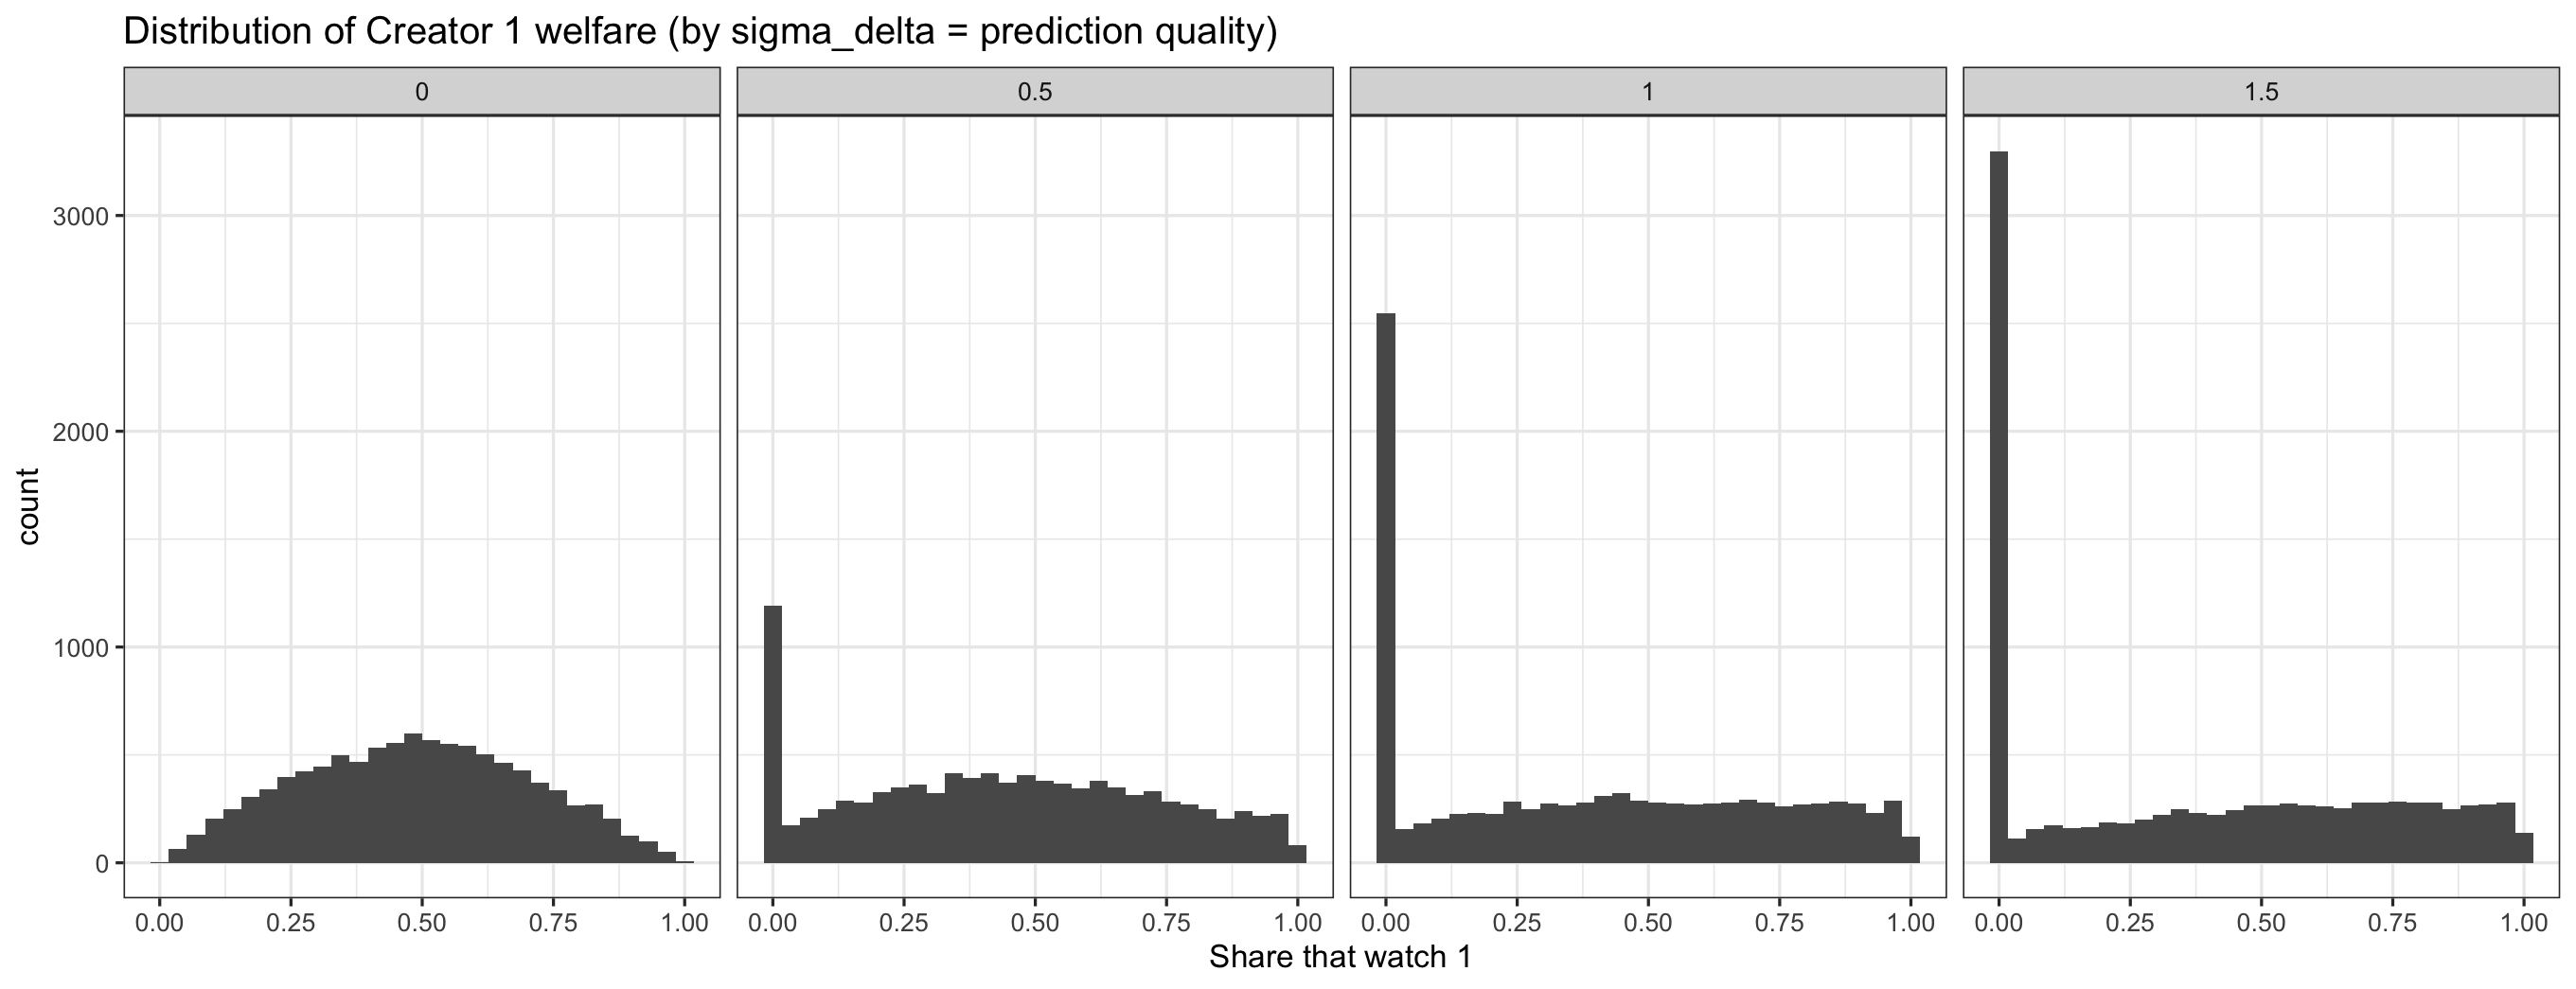
Likewise, here is a plot of the distribution of the share of viewers that watch creator 1 (creator 0 is symmetric):
Finally here is a table of the mean and SD of platform and creator (1) welfare across the same levels of prediction quality:
| Sigma | Mean Creator | SD Creator | Mean Platform | SD Platform |
|---|---|---|---|---|
| 0.0 | 0.49 | 0.21 | 0.97 | 0.10 |
| 0.5 | 0.44 | 0.29 | 0.87 | 0.17 |
| 1.0 | 0.39 | 0.33 | 0.79 | 0.21 |
| 1.5 | 0.37 | 0.34 | 0.75 | 0.23 |
So what do we see? As prediction quality increases ($\sigma_\delta$ decreases), platform and creator welfare increases, and the SD of these welfare values decreases.
I think that this is all pretty intuitive for this setup, but it does not yet capture the economic phenomenon I am interested in as described in my previous post.
In order to capture that, I think I will need to add some more to the model. I will need to experiment a bit, but some possibilities:
- Do I need to introduce a “subscription” stage at the beginning of the game, where viewers decide who to subscribe to?
- Do I need to introduce platform uncertainty about viewer horizontal preferences?
- Eventually, I am interested in exploring effects on the horizontal type of content produced, which would require some stage with a choice by creators? For example, maybe creators should have a choice about how much to invest in vertical quality (at some marginal cost?) vs. horizontal differenitation. And as prediction quality increases, creators are incentivized to invest more in vertical quality? i.e. content becomes more homogenous? Something like this.
I will update this post as I think about it more.