Visualize the Freezing and Thawing Cycle of Lake Mendota
Data Visualization
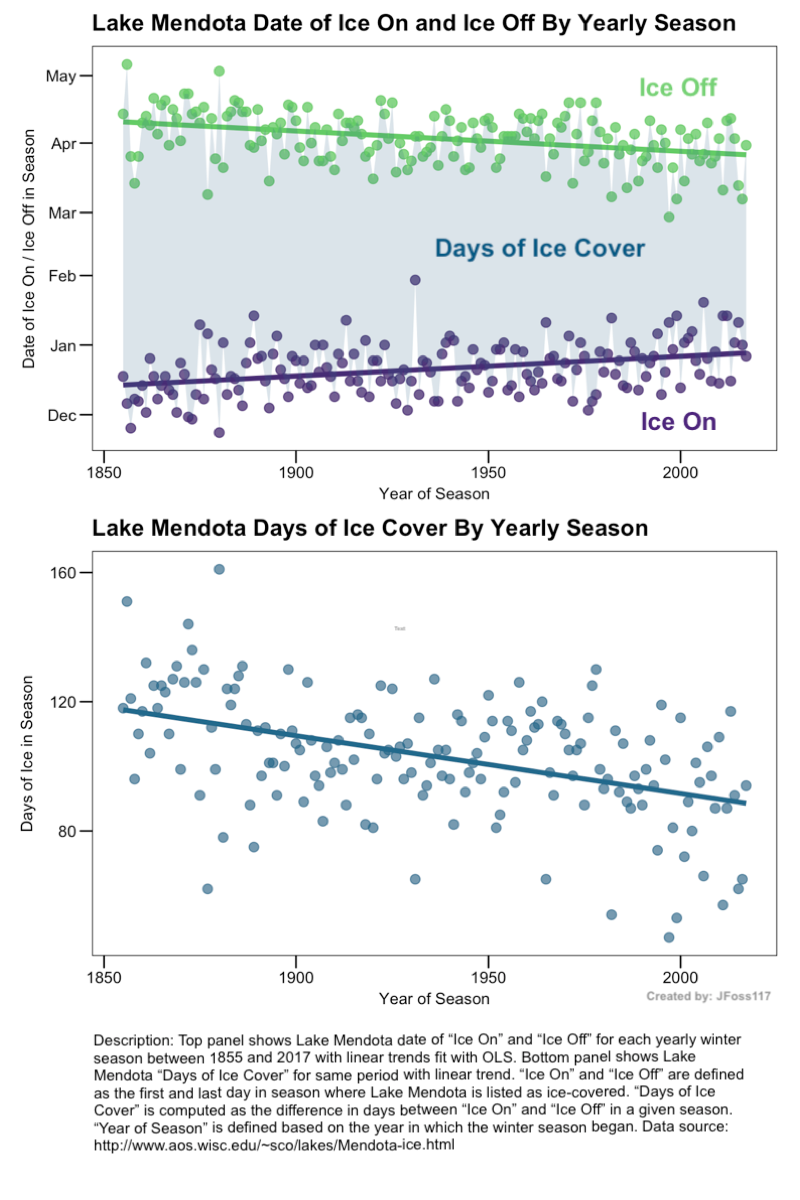
The goal of this data visualization is to explore trends over time in yearly “Ice On”, “Ice Off” and “Days of Ice Cover” on Lake Mendota using data from the Wisconsin State Climatology Office. The visualization is an entry in the December 2018 /r/dataisbeautiful DataViz Battle (UPDATE: this visualization was awarded second place in the competition).
Analysis
The plots show that Lake Mendota’s seasonal days of ice cover has decreased over time by 0.18 days per year on average (p<0.01; 95% CI: [0.12 0.23]). The decrease in total days of ice cover is due in roughly equal parts to “Ice On” occuring later in the season (roughly 0.09 days later per year on average; p<0.01) and “Ice Off” occuring earlier in the season (roughly 0.09 days earlier per year on average; p < 0.01). Here are bivariate regression results supporting these findings:
| Dependent variable: | |||
| Days of Ice Cover | Ice Off Day of Season | Ice On Day of Season | |
| (1) | (2) | (3) | |
| Trend | -0.179*** | -0.091*** | 0.088*** |
| (0.028) | (0.018) | (0.018) | |
| Constant | 117.489*** | 160.467*** | 43.225*** |
| (2.613) | (1.701) | (1.704) | |
| Observations | 163 | 163 | 163 |
| R2 | 0.203 | 0.135 | 0.127 |
| Residual Std. Error (df = 161) | 16.754 | 10.908 | 10.927 |
| F Statistic (df = 1; 161) | 41.066*** | 25.023*** | 23.345*** |
| *p<0.1; **p<0.05; ***p<0.01 | |||
Note that Ice On / Ice Off “Day of Season” are defined as the number of days after November 1st that Ice On / Ice Off occured so that the negative coefficient in model (2) means that Ice Off occured earlier in the season, while the positive coefficient in model (3) means that Ice On occurred later.
Data Preparation Details
Data for this analysis was pulled from here and was aggregated by “Season” (i.e. “Start Year”). Dates for Ice On and Ice Off were computed manually for each season based on the earliest/last date of reported ice cover respectively. “Days of Ice Cover” was computed manually as the difference between the derived Ice On and Ice Off dates. This derived field mostly matches the “Days” field of the original dataset, though deviates somewhat in cases where the Lake was opened / closed multiple times in a season. Note that the analysis excludes the seasons 1852-1854, as the data for these years were incomplete. All code for this analysis and visualization is available in the github for this blog post here (see the _code folder).
Please note that visualizations presented here were inspired by similar plots found in Magee et al. (2016).
References
Magee, M., Wu, C., Robertson, D., Lathrop, R., & Hamilton, D. (2016). Trends and abrupt changes in 104 years of ice cover and water temperature in a dimictic lake in response to air temperature, wind speed, and water clarity drivers. Hydrology and Earth System Sciences, 20(5), 1681-1702.