Estimating Rates of NFT Project Creation per Creator
In this post, I will build on my previous post about identifying the EOA creator of an NFT project. The questions that I would now like to answer are:
- What is the distribution of NFT projects (and assets) created per creator? (on Ethereum)
- What share of NFT creators create more than one project? (on Ethereum)
Where “creator” will be defined at the address level1. For this analysis, I will work with the ez_nft_mints table maintained by Flipside, which “contains NFT mint events on the Ethereum blockchain”. I note that minting is not identical to creating a contract; however, (1) I do not see a way to readily pick out the universe of NFT contracts on Flipside (except via the NFT minting/transfer/sales) tables2, and (2) first minting is arguably a more meaningful event for defining project creation anyhow.
With this in mind, to answer question (1) above, let’s proceed in the following way:
- Using
ez_nft_mints, collect all projects with at least one mint event (over a period of time). - For each project, find the timestamp (
block_timestamp) of the first minting event for that project (over some period). - Identify the EOA creator of the project in the manner described in my previous post, by identifying the creator as the EOA that initiated the transaction that created the NFT project’s contract.
Here is a base Flipside query implementing this logic:
WITH mint_events AS (
  SELECT
    nft_address
  , MIN(block_timestamp) AS first_mint_timestamp
  FROM
    ethereum.nft.ez_nft_mints
  WHERE
    block_timestamp > '2020-01-01'
    AND block_timestamp < '2024-01-01'
  GROUP BY
    nft_address
),
SELECT
  me.nft_address
, me.first_mint_timestamp AS ts_first_mint
, fc.block_timestamp AS ts_contract_creation
, fc.from_address AS creator_address_from_deploy_tx
FROM
  mint_events me
LEFT JOIN
  ethereum.core.dim_contracts dc ON me.nft_address = dc.address
LEFT JOIN
  ethereum.core.fact_transactions fc ON dc.created_tx_hash = fc.tx_hash;
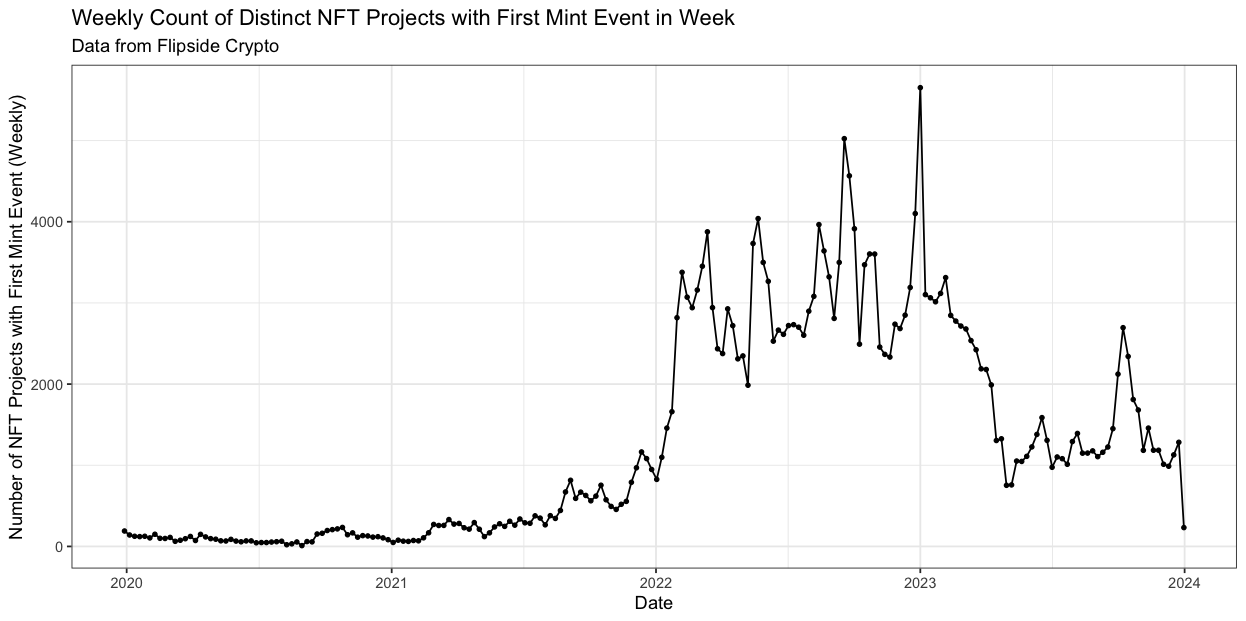
We can add aggregations on top of this query to start answering some of our initial questions. Let’s start with an even simpler question, asking how many distinct NFT projects are represented in this dataset, and how their first creation events are distributed over time. First, I find that there are 267,267 distinct NFT projects (contracts) represented in this dataset, which should include all Ethereum NFT projects with at least one mint event since Jan 1, 20203. Aggregating at the weekly level, here is the distribution of first mint events over time

Unsurprisingly, this mostly tracks the general rise and fall of the NFT space: slowly building through 2021, with the most activity in 2022, and then falling off in 2023. In peak weeks, there are on the order of 5,000 projects created4.
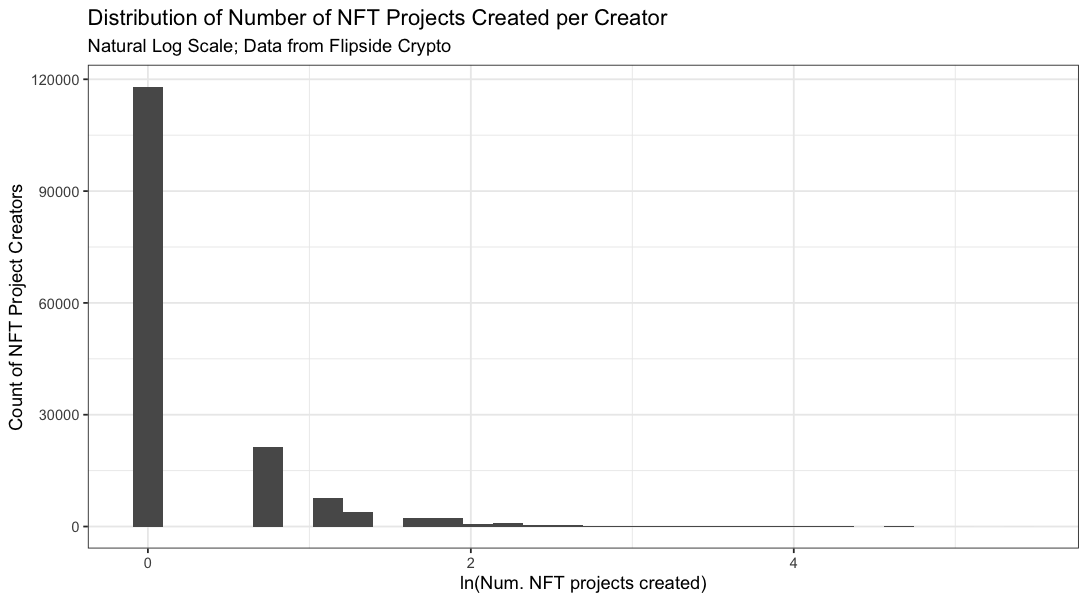
Next, we can consider the volume of project creations (first mint events) per creator (aggregation query in notes below). First, I find that there are 158,454 distinct creators for our 267,267 projects, which means that the average creator has created 1.69 projects over this period. The standard deviation is 2.73 projects, and the median is 1. I find that 74.4% of creators have created exactly one project, meaning that about 25.6% create two or more, addressing question (2) above. As we might expect, the full distribution of projects created per creator is quite skewed; here it is on a natural log scale:

Here are the ten creator addresses that have created the most NFT contracts based on this methodology (with an attempt to link to their OpenSea page if it exists):
Where the linked OpenSea pages exist, these do seem to be high volume creators; however, there are a number of cases where no OpenSea page is found. I am not sure why this is. As far as I can tell from etherscan, these are legitimate wallet addresses which is good.
One concerning record is this one, which is called “Ethernity Deployer” and seems to Etherenal Labs. I don’t know much about this project; however, for my purposes the concern is that this does not seem to be an individual creator – i.e. my method for identifying individual creators still has some limitations, which I will need to consider further.
Finally, we can also try validating by looking at some more “typical” creators; here is a set of five random creators (with opensea links) that I find have created exactly one NFT project:
Manually inspecting, these do seem to be creators who have created a single NFT project (or less) according to OpenSea. For some reason this account does not have any created assets on OpenSea; however, I am able to verify via Etherscan that this address is indeed the creator of this NFT contract. I will need to dig in further on some of these edge cases, and also try to think more about how to validate my methdology5.
Appendix
Here is the query for daily aggregations:
WITH mint_events AS (
  SELECT
    nft_address
  , MIN(block_timestamp) AS first_mint_timestamp
  FROM
    ethereum.nft.ez_nft_mints
  WHERE
    block_timestamp > '2021-01-01'
    AND block_timestamp < '2024-01-01'
  GROUP BY
    nft_address
)
SELECT
  ts_first_mint::DATE as DS
, COUNT(DISTINCT nft_address) as n_projects_with_first_mint
FROM(
SELECT
  me.nft_address
, me.first_mint_timestamp AS ts_first_mint
, fc.block_timestamp AS ts_contract_creation
, fc.from_address AS creator_address_from_deploy_tx
FROM
  mint_events me
LEFT JOIN
  ethereum.core.dim_contracts dc ON me.nft_address = dc.address
LEFT JOIN
  ethereum.core.fact_transactions fc ON dc.created_tx_hash = fc.tx_hash
)
GROUP BY 1
ORDER BY 1
;
Here is the query for creator-level aggregation:
WITH mint_events AS (
  SELECT
    nft_address
  , MIN(block_timestamp) AS first_mint_timestamp
  FROM
    ethereum.nft.ez_nft_mints
  WHERE
    block_timestamp > '2021-01-01'
    AND block_timestamp < '2024-01-01'
  GROUP BY
    nft_address
)
SELECT
  creator_address_from_deploy_tx
, COUNT(DISTINCT nft_address) as n_projects_created
, MIN(ts_first_mint) AS ts_first_mint
FROM(
  SELECT
    me.nft_address
  , me.first_mint_timestamp AS ts_first_mint
  , fc.block_timestamp AS ts_contract_creation
  , fc.from_address AS creator_address_from_deploy_tx
  FROM
    mint_events me
  LEFT JOIN
    ethereum.core.dim_contracts dc ON me.nft_address = dc.address
  LEFT JOIN
    ethereum.core.fact_transactions fc ON dc.created_tx_hash = fc.tx_hash
)
GROUP BY 1
ORDER BY 1
;
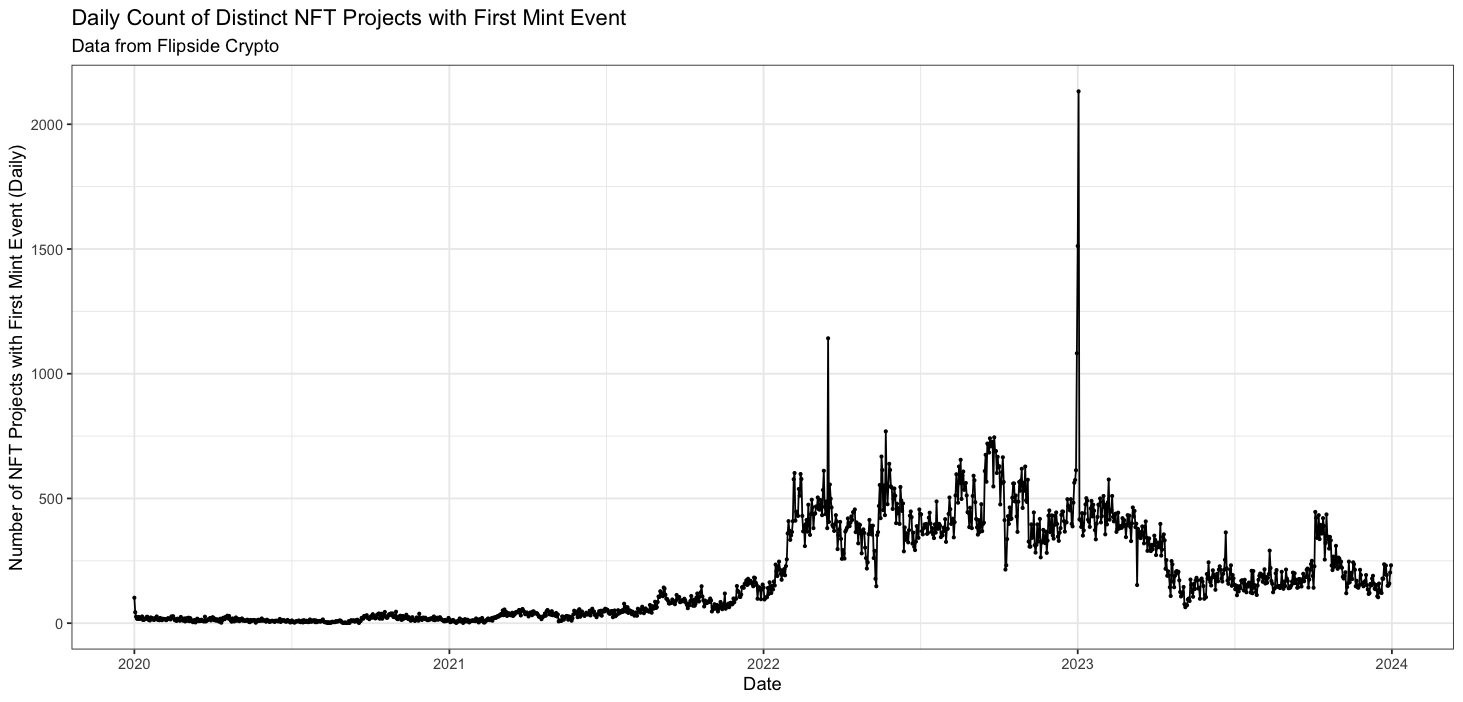
Here is a daily version of the weekly chart from above.

Footnotes
-
We know individual creators can of course create more than one address, and so this is not perfect. However, it seems like the only real option for now. ↩
-
The
dim_nft_metadatatable says that it only includes information about “popular” collections, not the full universe of collections. ↩ -
I would love to have a sanity check of whether this number seems “reasonable”; however, I am having difficulty finding a good external reference for a stat similar to this one. Let me know if you have one. ↩
-
At the daily level, I note that the volume of new projects is quite large right around 2023-01-01, with 2022-12-31, 2023-01-01 and 2023-01-02 all being among the four highest volume dates (see daily version of chart above). I was initially worried this might be a data anomaly (e.g. defaulting timestamps to
2023-01-01 00:00:00or something similar); however, on further inspection, the high volume of creation on the surrounding dates suggests something else is going on; however, I don’t know exactly what. If you do, please tell me! ↩ -
All the code for this analysis can be found on my github here ↩